
Climate change in Hong Kong
The Hong Kong Observatory (HKO) has been conducting meteorological observations since 1884 except for the Second World War during 1940-1946. The HKO possesses more than 130 years of meteorological observation records which are important references for climate change researches in Hong Kong.
(a)Temperature rise
Fig 3.1 shows a long-term ascending trend of the annual average temperature in Hong Kong. For the past hundred years, the annual average temperature increased at a rate of about 0.12°C per decade. The increase has become more significant in the later half of the 20th century.
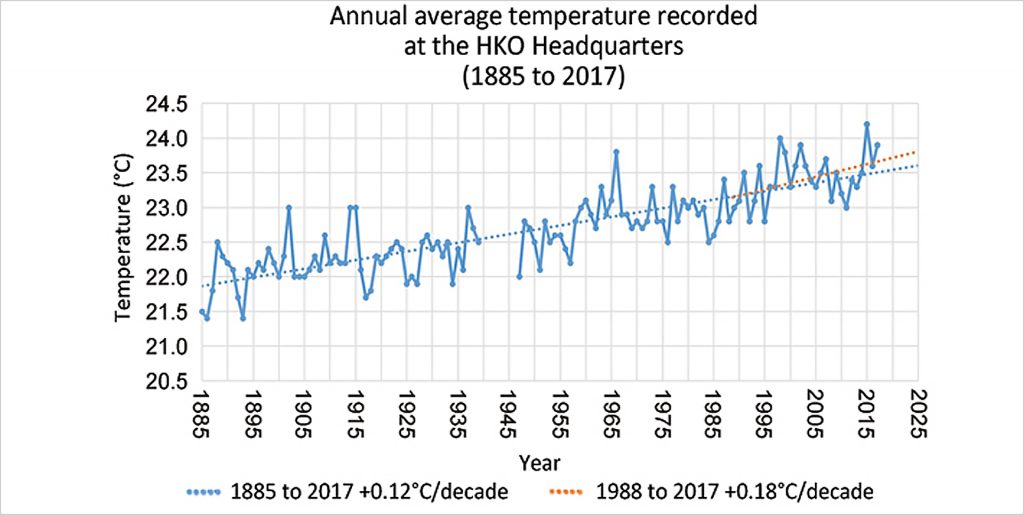
Fig 3.1 Annual average temperature recorded at the HKO Headquarters i (Data source: HKO)
★ More Information
Latest temperature trends
https://www.hko.gov.hk/climate_change/obs_hk_temp_e.htm
(b)More very hot days but fewer cold days
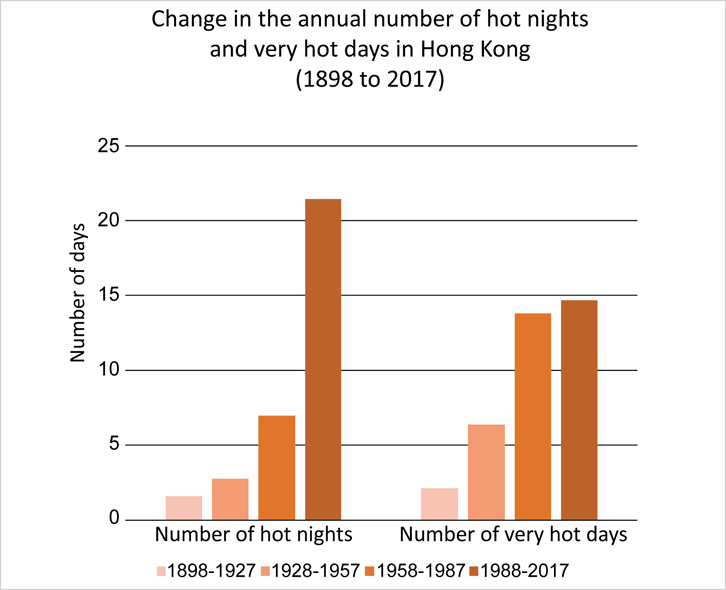
The number of hot nights (with a daily minimum temperature of 28°C or above) and very hot days (with a daily maximum temperature of 33°C or above) have increased by about 35 times and 6 times respectively over the last hundred years or so. On the contrary, the number of cold days (with a daily minimum temperature of 12°C or below) has decreased.
 |
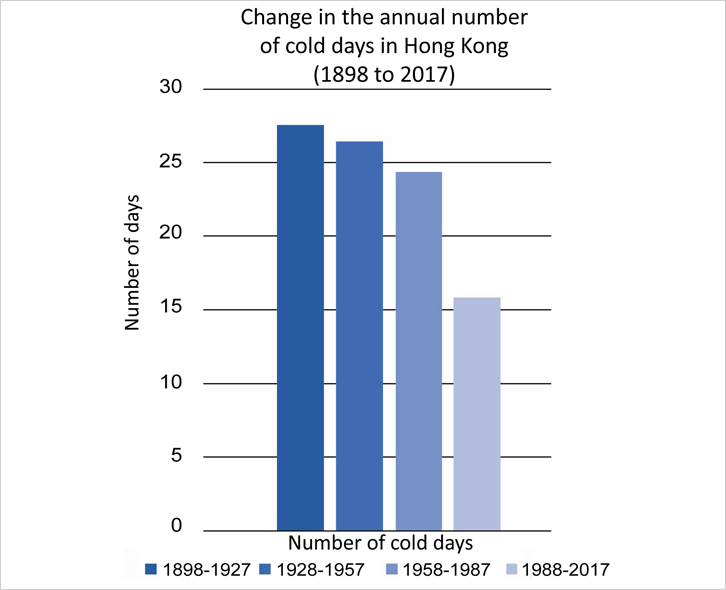 |
| Fig 3.2a Change in the annual number of hot nights and very hot days in Hong Kong ii (Data source: HKO) | Fig 3.2b Change in the annual number of cold days in Hong Kong (Data source: HKO) |
(c)More frequent extreme rainfall
Extreme rainfall events have become more frequent. The hourly rainfall record at the HKO Headquarters was usually broken once per decade in the past, but it was repeatedly broken in recent decades. The latest record of the highest hourly rainfall at the HKO Headquarters was 145.5mm in 2008. A more sophisticated analysis shows that the chance of an extreme rainfall event with hourly rainfall of 100 mm or more has doubled over the last century.
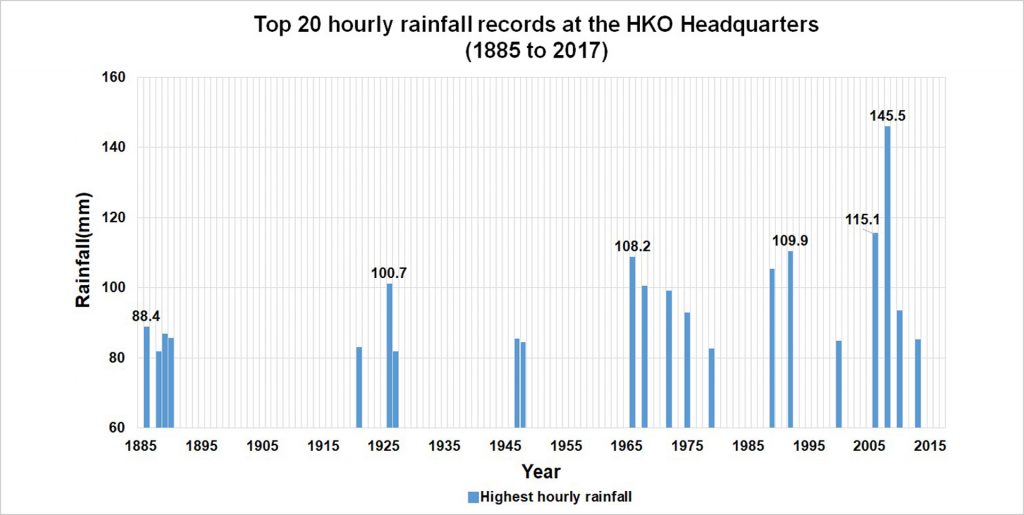
Fig 3.3 Top 20 hourly rainfall records at the HKO Headquarters iii (Data source: HKO)
★ More Information
Extreme weather events
https://www.hko.gov.hk/climate_change/obs_hk_extreme_weather_e.htm
(d)Sea level rise
Tide gauge records in Victoria Harbour since 1954 indicated an obvious rise of the mean sea level. On average, the mean sea level in Victoria Harbour rose at a rate of about 31 mm per decade in the past 60 years or so.
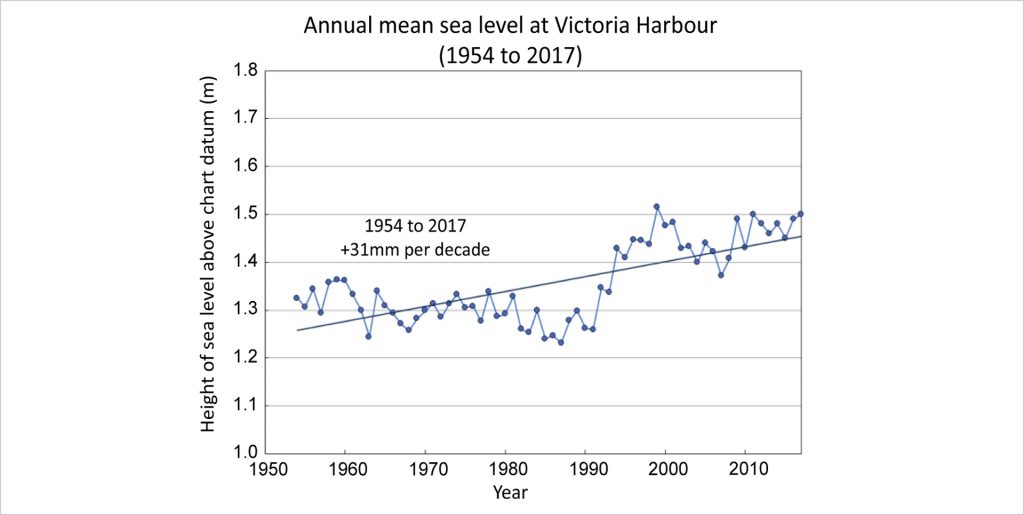
Fig 3.4 Annual mean sea level at Victoria Harbouriv (Source: HKO)
★ More Information
Latest mean sea level trend
https://www.hko.gov.hk/climate_change/obs_hk_sea_level_e.htm