
The scientific evidence of climate change
A large number of studies have shown that the scientific evidence of climate change is overwhelming, and there is a clear scientific consensus among climate scientists. The scientific evidence of climate change is set out in the following.
(a)Increasing global surface temperature
The analyses of global temperature data from various meteorological institutions and research centres have reached the same conclusion that the average global temperature has been increasing significantly over the past hundred years. According to the WMO Statement on the State of the Global Climate in 2017i, global mean temperature in 2017 was about 1.1 °C above pre-industrial levels (Fig 1.7). Fig 1.8 shows almost every corner of the globe has experienced a warming trend over the past hundred years.
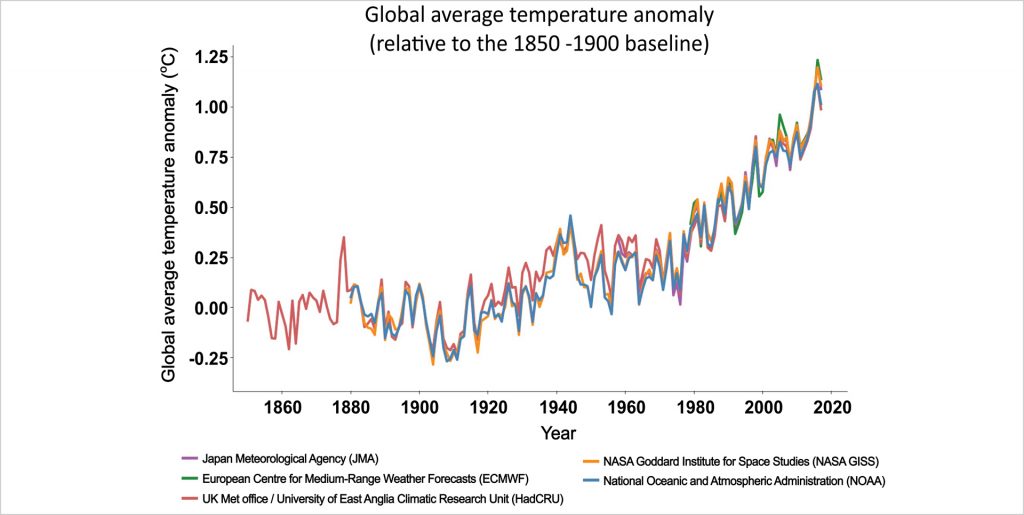
Fig 1.7 Global average temperature anomaly (Source: The WMO Statement on the State of the Global Climate in 2017)
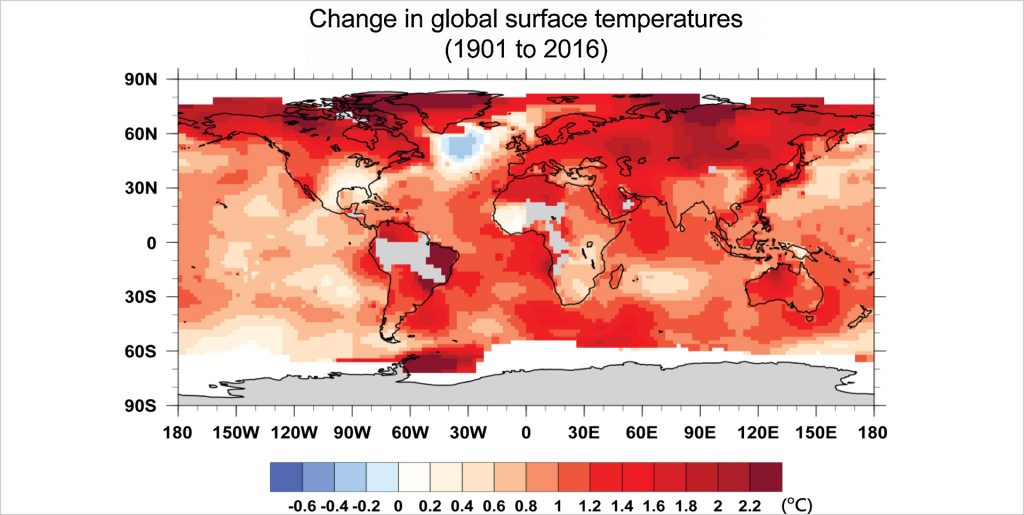
Fig 1.8 Change in global surface temperatures (Data source: NASA)
★ More information
The latest global temperature trend
https://www.hko.gov.hk/climate_change/global_temp_e.htm
The reality of the inconvenient truth
https://www.hko.gov.hk/blog/en/archives/00000118.htm
➤ How long has the global surface temperature been persistently higher than the 20th century average?
https://www.ncdc.noaa.gov/cag/global/time-series/globe/land_ocean/all/1/1970-2018
★ More information
Is global warming really at work?
https://www.youtube.com/watch?v=sL854WHFSP4
➤ Why snowstorms and extremely cold weather still occur in some regions under global warming?
Cold events in a certain place at a certain time are just weather, and say nothing about climate. Against the backdrop of natural climate variability, global warming refers to the increase in global average temperature since the 20th century as a result of human activities. Snowstorms and extremely cold weather are parts of the natural climate variability and are not precluded by global warming. However, global warming has reduced the frequency of extremely cold events over the last few decades. The frequency of extremely cold events is expected to decrease further if global temperature keeps rising in the future.
(b) Increase in sea surface temperature and ocean heat content
The ocean covers more than 70% of the Earth’s surface. The heat capacity of ocean is much higher than that of land. Fig 1.9a and Fig 1.9b clearly show the long-term increasing trend of sea surface temperature and ocean heat content.
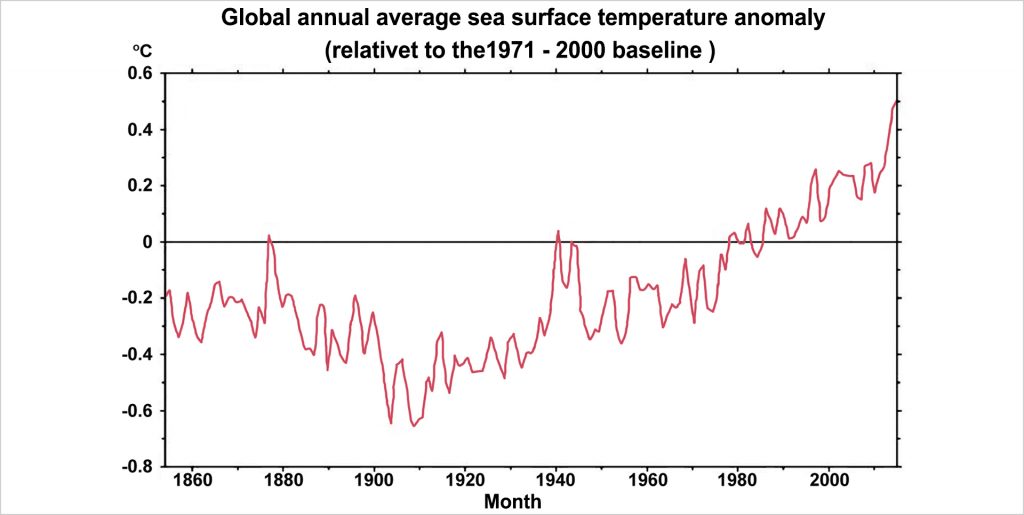
Fig 1.9a Global annual average sea surface temperature anomaly ii
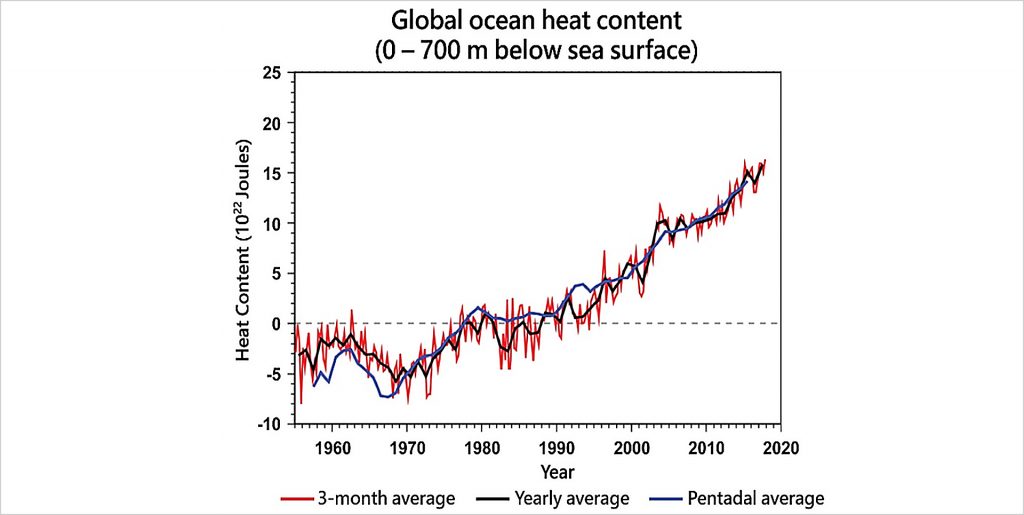
Fig 1.9b Global ocean heat content iii (0 – 700m below sea surface)(Source: US National Oceanic and Atmospheric Administration (NOAA))
➤ Climate change: Ocean heat content
The ocean absorbs and stores energy from the Sun. If the ocean absorbs more heat than it releases, the heat content increases.
www.climate.gov/news-features/understanding-climate/climate-change-ocean-heat-content
The latest ocean heat content
https://www.ncdc.noaa.gov/cdr/oceanic/ocean-heat-content
Ocean heat as ‘fuel’ for tropical cyclones
https://www.yaleclimateconnections.org/2018/05/ocean-heat-as-fuel-for-hurricanes/
(c) Shrinking sea ice
Arctic sea ice is decreasing in all seasons. The decrease is particularly more prominent in summer. Studies have shown that the loss of Arctic summer sea ice over the past 30 years was unprecedented in the last 1,450 years.

Fig 1.10 July to September Arctic sea ice extent (Data source: US National Snow and Ice Data Center (NSIDC))
★ More information
The latest Arctic sea ice extent
http://nsidc.org/data/seaice_index/images/daily_images/N_stddev_timeseries.png
Disappearing Ice
https://svs.gsfc.nasa.gov/4616
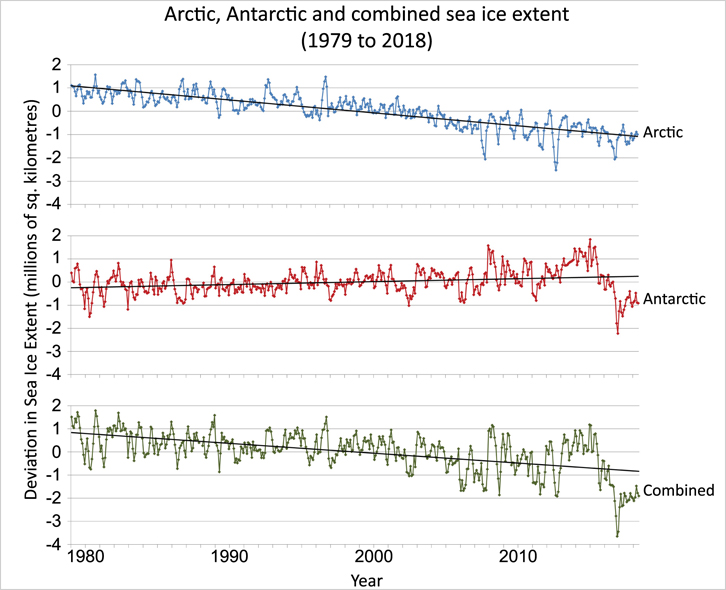
Although Antarctic sea ice extent has increased slightly over the past few decades, the overall global sea ice extent is on the decline. Antarctic sea ice extent exhibits large fluctuations in recent years and hit its lowest value ever recorded by satellites in early 2017.
 |
 |
| Fig 1.11 Arctic, Antarctic and combined sea ice extent (Data source: NSIDC) |
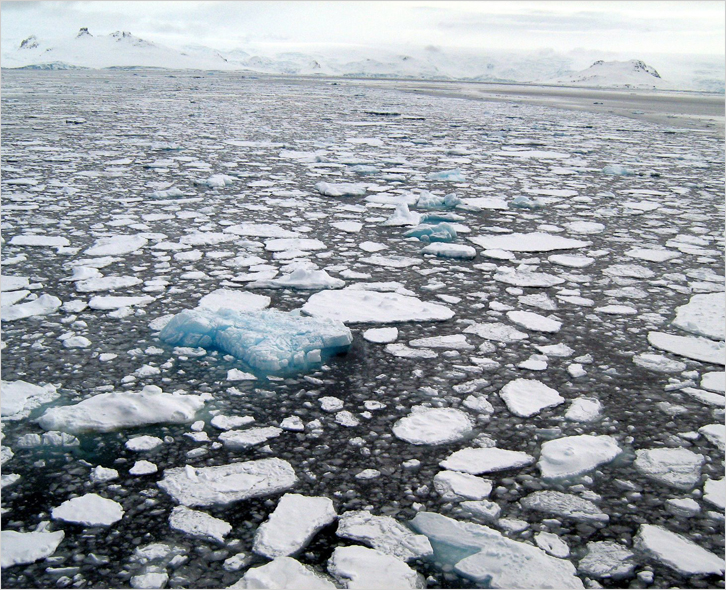
Fig 1.12 Antarctic sea ice (2007) (Source: Acaroiv) |
★ More information
Changes of Antarctic sea ice extent from 31 August 2016 to 3 March 2017
https://svs.gsfc.nasa.gov/4562
(d) Decrease in the Northern Hemisphere snow cover extent
Snow cover extent has decreased in the Northern Hemisphere, especially in spring.

Fig 1.13 Change in snow cover extent of the Northern Hemisphere in spring (Data source: Rutgers Universityv)
(e)Mass loss of ice sheets
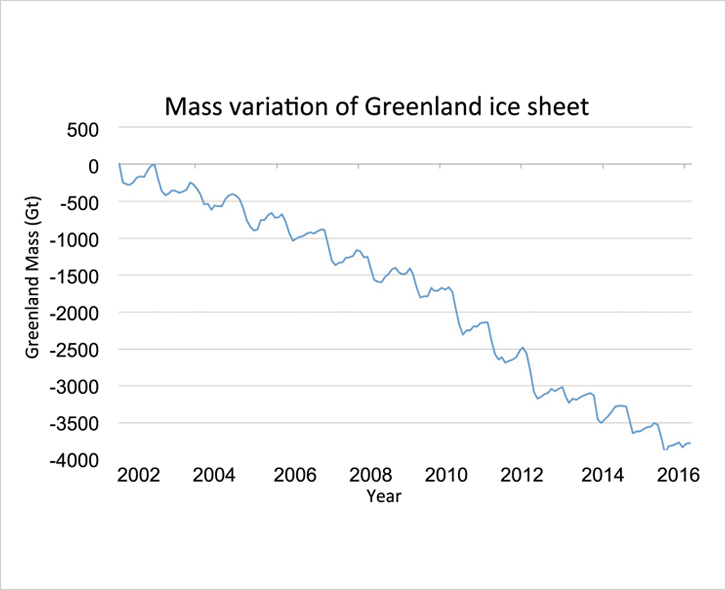
The Greenland and Antarctic ice sheets are the two largest ice sheets on Earth. In recent years, scientists measure the ice mass variation of Antarctica and Greenland by tracking gravity changes on Earth with satellites. Mass loss of the Greenland ice sheet has accelerated since 1992. The average rate of ice loss has increased from 34 billion tonnes per year over the period of 1992 – 2001 to 215 billion tonnes per year over the period of 2002 – 2011.
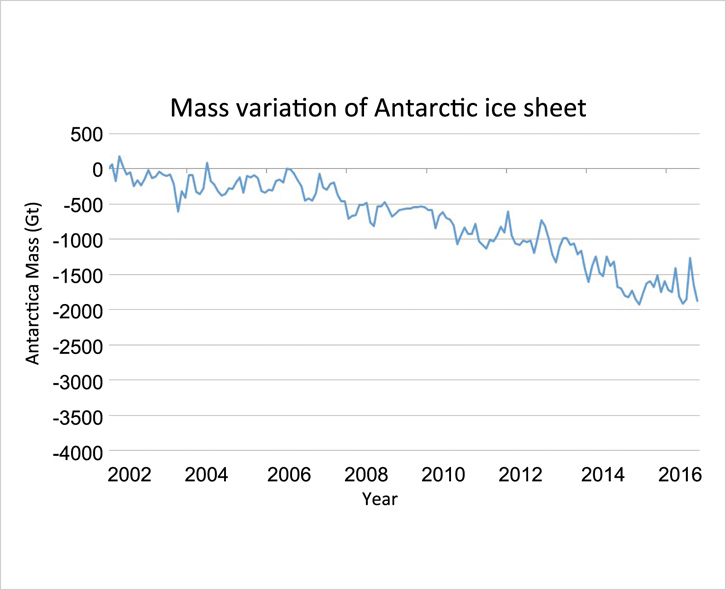
The average rate of ice loss from the Antarctic ice sheet has increased from 30 billion tonnes per year over the period of 1992 – 2001 to 147 billion tonnes per year over the period of 2002 – 2011. The losses are mainly from the northern Antarctic Peninsula and the Amundsen Sea sector of West Antarctica.

圖1.14 Distribution of ice loss for Antarctica and Greenland (2003 to 2012) (Source: The Fifth Assessment Report of IPCC)
 |
 |
| Fig 1.15a Mass variation of Antarctic ice sheet (Data source: NASA) |
Fig 1.15b Mass variation of Greenland ice sheet (Data source: NASA) |
★ More information
The latest mass variation of Antarctic and Greenland ice sheets
https://climate.nasa.gov/vital-signs/ice-sheets/
Ice losses from Antarctica have tripled since 2012, accelerating global sea level rise
https://climate.nasa.gov/news/2749/ramp-up-in-antarctic-ice-loss-speeds-sea-level-rise/
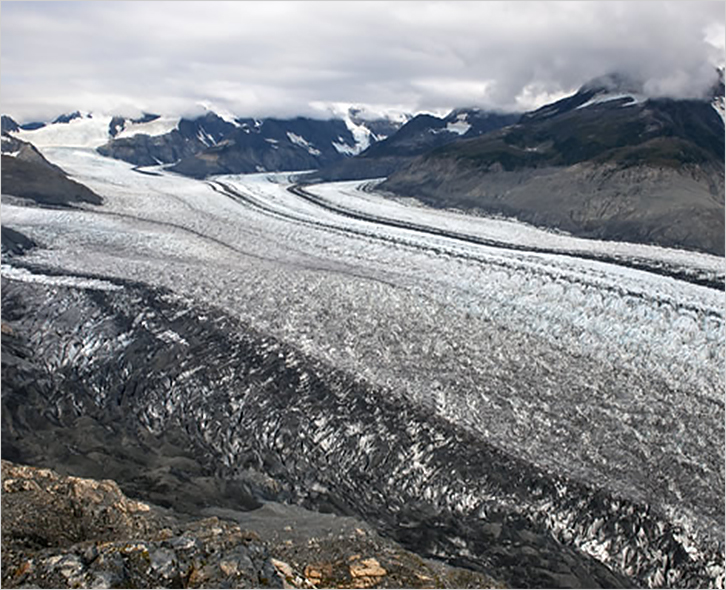
(f) Retreating glaciers
Report of World Glacier Monitoring Service (WGMS) indicates that the overall mass balance of glaciers in the world has continued to shrink for about 40 years. The mean annual mass balance of global glaciers has been persistently negative since 1980vi.

Fig 1.16 Persistent negative balance of the mean annual mass balance of global glaciers (Source: WGMS)
 |
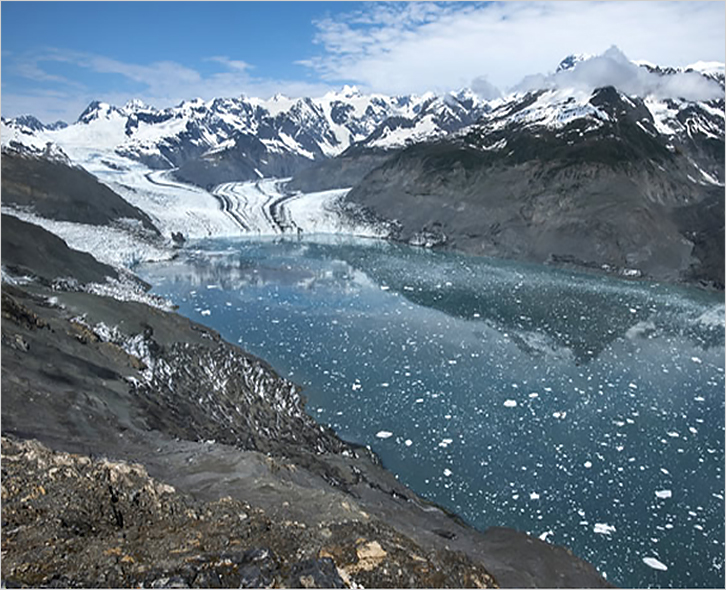 |
| 圖1.17a Columbia Glacier, Alaska in 2009 (Source: James Balog and the Extreme Ice Survey) |
圖1.17b Columbia Glacier, Alaska in 2015 (Source: James Balog and the Extreme Ice Survey) |
★ More information
Latest glacier mass balance
http://wgms.ch/latest-glacier-mass-balance-data/
The film “Chasing Ice” captured the largest glacier calving event in Greenland
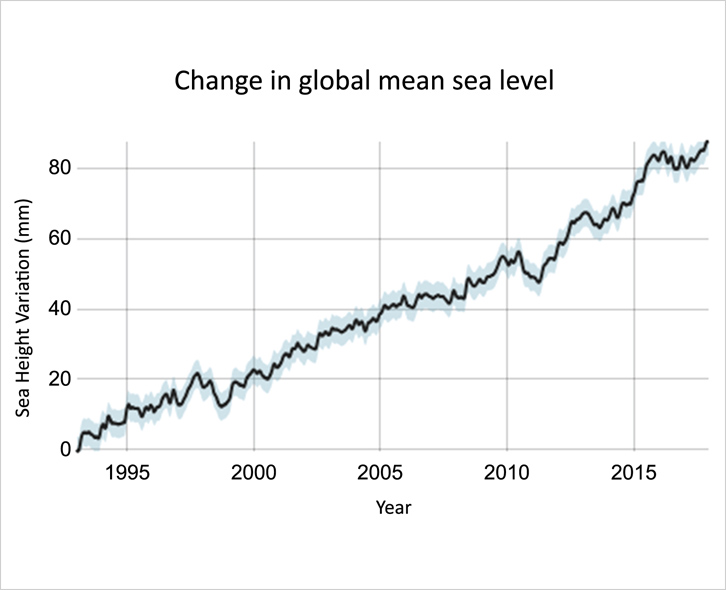
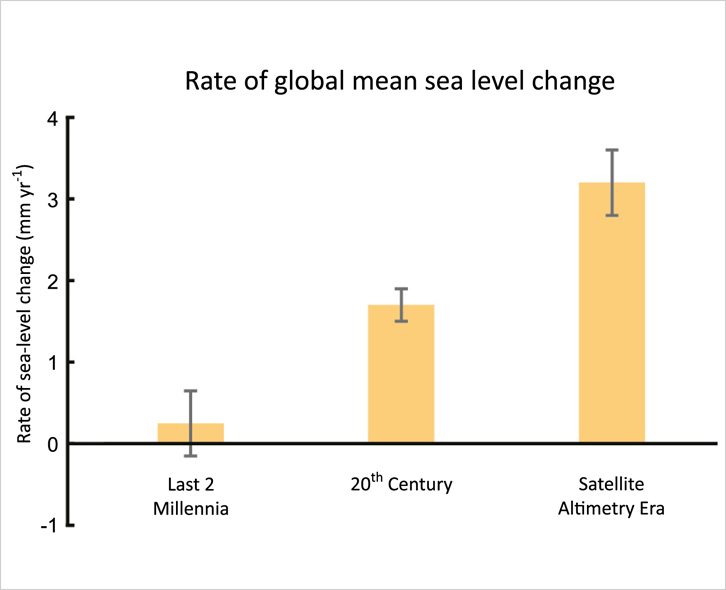
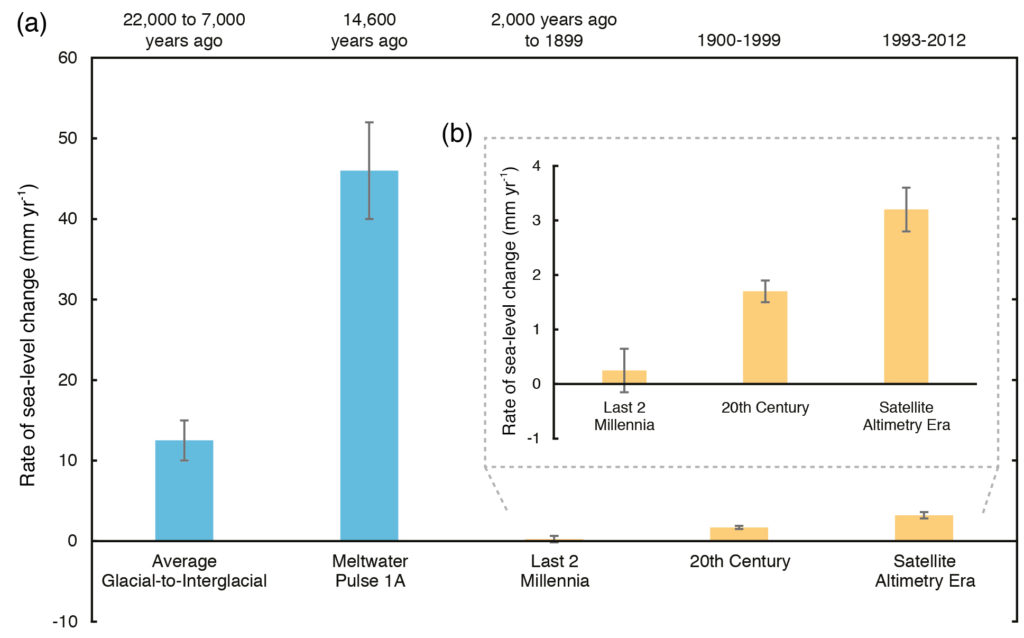
(g) Sea level rise
Seawater expands when it warms and melting land-based ice and snow adds water to the oceans, resulting in global sea level rise. As shown in Fig 1.18a, satellite data clearly shows the rise of global sea level over the past 20 years. Fig 1.18b, extracted from the Fifth Assessment Report of IPCC, shows that the rate of global sea level rise during the satellite altimetry era is nearly twice the average rate over the 20th century, which, in turn, is much higher than the average rate over the last two millennia.
★ More information
Latest sea level
https://climate.nasa.gov/vital-signs/sea-level/
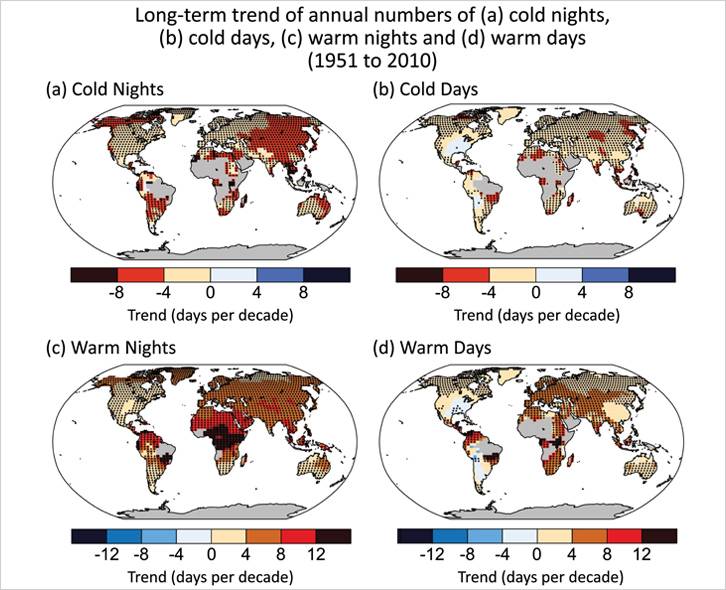
(h) More frequent extreme weather events
Climate change leads to changes in the frequency, intensity, spatial extent, duration, and timing of extreme weather events. According to the Fifth Assessment Report of IPCC, the numbers of warm days and nights have increased globally since 1950 while the numbers of cold days and nights have decreased. Most land areas have experienced more heat waves since the middle of the 20th century. More land regions experience increase in heavy precipitation events.
 |
|
| Fig 1.19 Long-term trend of annual numbers of (a) cold nights, (b) cold days, (c) warm nights and (d) warm daysix (Source: The Fifth Assessment Report of IPCC) |
Both the Fourth and Fifth Assessment Reports of IPCC confirmed that warming of the climate system was unequivocal.
➤ What is IPCC?
The Intergovernmental Panel on Climate Change (IPCC), established under the auspices of the World Meteorological Organization (WMO) and the United Nations Environment Programme (UNEP), is a scientific body tasked to evaluate the risk of climate change caused by human activities.
Climate change is a very complex issue. Policymakers need an objective source of information about the causes of climate change, its potential environmental and socio-economic consequences, and the adaptation and mitigation options to respond to its impacts. This is the key motivation behind the establishment of IPCC in 1988 as the authority on climate change.
The main activity of IPCC is the compilation of assessment reports on a regular basis. The First Assessment Report in 1990 played a decisive role in the establishment of the United Nations Framework Convention on Climate Change (UNFCCC). The Second Assessment Report in 1995 provided key input to the negotiations of the Kyoto Protocol. The Third Assessment Report in 2001 and a number of special reports provided relevant information for the development of the UNFCCC and the Kyoto Protocol. The Fourth Assessment Report in 2007 confirmed that warming of the climate system was unequivocal. The Fifth Assessment Report in 2013 reaffirmed this finding and concluded that it was extremely likely that human influence had been the dominant cause behind the observed warming since the mid-20th century.
Reference: https://www.ipcc.ch/about/
Source of figures and data in Chapter 7.1
[i] https://library.wmo.int/opac/doc_num.php?explnum_id=4453
[ii] www.ncdc.noaa.gov/data-access/marineocean-data/extended-reconstructed-sea-surface-temperature-ersst-v5
[iii] www.ncdc.noaa.gov/cdr/oceanic/ocean-heat-content
[iv] https://commons.wikimedia.org/wiki/File:Sea_ice_Antarctica.JPG
[v] https://climate.rutgers.edu/snowcover/table_area.php?ui_set=1&ui_sort=0
[vi] https://wgms.ch/downloads/Fig1_2016.pdf
[vii] https://climate.nasa.gov/vital-signs/sea-level/
[viii] https://www.ipcc.ch/site/assets/uploads/2018/02/FigFAQ5.2-1-1024×638.jpg
[ix] www.climatechange2013.org/images/figures/WGI_AR5_Fig2-32.jpg